
Watersheds are nature’s way of dividing up the landscape. Rivers, lakes, estuaries, wetlands, streams, even the oceans can serve as catch basins for the land adjacent to them. Ground water aquifers serve the same purpose for the land above them.The actions of people who live within a watershed affect the health of the waters that drain into it.
John Wesley Powell –– scientist, geographer, and leader of the first expedition through the Grand Canyon in 1869– perhaps described it best when he said that a watershed is: ” that area of land, a bounded hydrologic system, within which all living things are inextricably linked by their common water course and where, as humans settled, simple logic demanded that they become part of the community.”
Map of water quality monitoring stations:

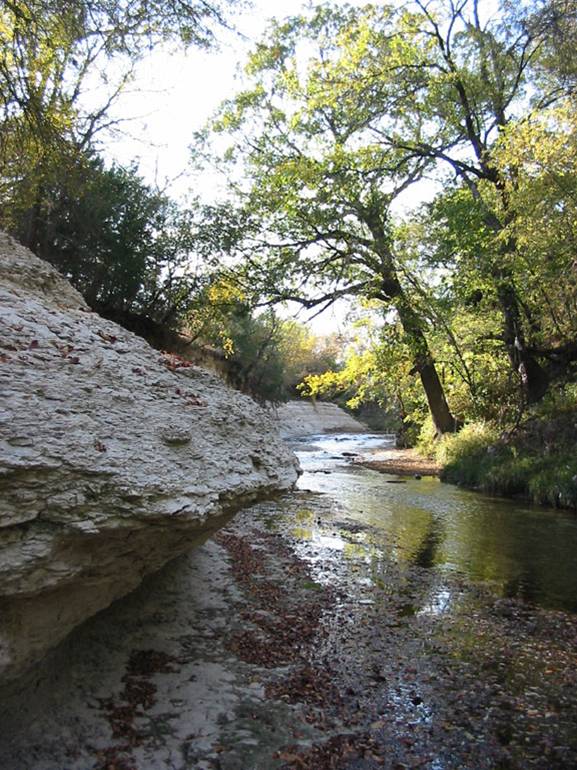
- Read more: The Ten Biggest American Cities That Are Running Out Of Water – 24/7 Wall St. http://247wallst.com/2010/10/29/the-ten-great-american-cities-that-are-dying-of-thirst/3/#ixzz13yhgCK3D Spring Creek, a tributary to Rowlett Creek and the East Fork of the Trinity River June 21, 2003Houston: Throughout most of its history, the city of Houston primarily drew water from the Jasper Aquifer, located along the southeastern coast of Texas.
STORMWATER
Feb. 3, 2009
Albert Lawrence, Storm Water Utility Manager
City of Garland
Because impervious surfaces (parking lots, roads, compacted soil) do no allow rainfall to infiltrate into the soil, more runoff is generated than in the undeveloped condition. This additional runoff can erode Spring Creek and other streams as well as cause flooding when the stormwater collection system is overwhelmed by the additional flow. Solid wastes such as water bottles cause additional problems by clogging the city’s drainage system. Because the water is flushed out of the watershed during the storm event, little infiltrates the soil, replenishes groundwater or supplies stream base flow in dry weather. Pollutants entering surface waters during precipitation events is termed polluted runoff. Daily human activities result in deposition of pollutants on roads, lawns, roofs, etc. When it rains or there is irrigation, water runs off and makes its way to Spring Creek, Lake Ray Hubbard, and eventually the Houston metroplex…ultimately the Gulf of Mexico. While there is some attenuation of these pollutants before entering the receiving waters, the quantity of human activity results in large enough quantities of pollutants to impair these receiving waters. Below are lab results from wet weather water samples from Spring Creek collected in 2008:
GA0801 Spring Creek at Shiloh on the south bank 32.9683611 -96.6645555
GA0802 Spring Creek at N. Garland Ave.. 32.9597777 -96.6500555
GA0803 Spring Creek at President George Bush Turnpike 32.9547222 -96.6245555
| Station | TDS | TSS | BOD | COD | Nitrogen | Phosphorus | |||||||||||||
| (Dissolved) | |||||||||||||||||||
| GA0801 | 438 | 132.8 | 5.9 | 43 | 2.55 | 0.0725 | |||||||||||||
| GA0802 | 461.5 | 227.2 | 3.3 | 11.1 | 2.044 | 0.0675 | |||||||||||||
| GA0803 | 450 | 85.1 | 3.6 | 12 | 1.363 | 0.07 | |||||||||||||
| Diazinon | Arsenic | Copper | Cadmium | Lead | Zinc | Chromium | |||||||||||||
| 0.0264 | 0.005 | 0.0346 | 0.0016 | 0.015 | 0.0443 | 0.005 | |||||||||||||
| 0.0264 | 0.004 | 0.0321 | 0.0016 | 0.022 | 0.0598 | 0.005 | |||||||||||||
| 0.0185 | 0.001 | 0.022 | 0.0005 | 0.009 | 0.031 | 0.003 | |||||||||||||
| Phosphorus | Oil & | E. | Coliform | pH | pH | ||||||||||||||
| (Total) | Grease | Coli | (Total) | Lab | Field | ||||||||||||||
| 0.109 | 130.75 | 5201 | 295430 | 7.27 | 8.23 | ||||||||||||||
| 0.124 | 2.19 | 4110 | 173681 | 7.29 | 8.69 | ||||||||||||||
| 0.104 | 2.27 | 136 | 53677 | 7.42 | 7.76 | ||||||||||||||
Notes: The map shows that the Spring Creek watershed is largely residential , not industrial as many think. Problems with water quality can, therefore, be traced to residential sources for the most part. Year 3 samples taken in 2008 at Spring Creek included measurements of suspended solids, pH, metals, biological oxygen demand (BOD), and other measurements. Samples were taken during rain events which had at least 0.10 inch of rain following a 72 hour period with no more than 0.10 inch of rain.
All concentrations were normal except for total suspended solids (TSS), and bacterial (e.coli ). TSS levels were slightly elevated, but not of too much concern. E.coli concentrations, however, were high and means Spring Creek is not suitable for contact recreation such as wading or swimming. Sources of e.coli contamination include sanitary sewer overflow, warm-blooded animal waste, and improper backup pipes in domestic homes. Spring Creek water quality conditions are worse upstream in the cities of Richardson and Plano.
Development standards for the Spring Creek Preserve are more stringent than other areas in Garland. Ordinances for protecting the Preserve can be found online athttp://codes.franklinlegal.net/garland-flp/
Sec. 31.106. Special development regulations for the Rowlett and Spring Creek 100-year flood plains.
(A) The following provisions shall apply to all proposed development within the Rowlett and Spring Creek 100-year flood plains, as more particularly described on the Albert H. Halff Associates, Inc., series April 1987 topographical maps, Project AVO-8470, Sheets 6-7, 18-20, 31-34, 45-57, 59-66 and 72-78.
(1) Base flood elevations (BFE) for the 100-year flood event that reflect ultimate development land use throughout the watershed shall be used for design and planning of flood plain development.
(2) Development within the flood plain shall be permitted only if it can be demonstrated that there will be no rise in the base flood elevation.
(3) Fill volumes shall be balanced (+/- 15%) by excavation volumes to preserve overall valley storage within the flood plain. Areas excavated shall be landscaped to restore a natural cover.
(4) The bed and banks of Rowlett and Spring Creeks shall be left in a natural state to control erosive velocities, prevent excessive downstream discharges and preserve the natural effect of the stream. Exceptions are permitted for major bridge crossings, public welfare and safety.
(5) Increases to existing average velocities shall be allowed to a maximum average velocity of no greater than six (6) feet per second.
(6) Significant stands of trees and other environmental features within the flood plain shall be preserved.
STATION 08061540 ROWLETT CREEK NR SACHSE, TX Spring Creek is a tributary to Rowlett Creek. This web site by the U.S. Geological Survey Water Resources Division provides water quality and streamflow information for streams in Texas, including this monitoring site closest to Spring Creek Preserve: Rowlett Creek near the town of Sachse (STATION 08061540). The station is maintained in cooperation with the City of Dallas, Water Utilities Department. By clicking on this site, you can plot gage height (measurement of surface water elevation) or discharge (measurement of streamflow in cubic feet per second). Other information includes water quality parameters such as alkalinity, nitrates, dissolved oxygen, and pH. Since Spring Creek is a tributary to Rowlett Creek, hydrologic conditions are similar, but with a lower discharge rate since the further up a tributary you travel, the smaller the contributing watershed area for surface runoff and shallow groundwater discharge. The drainage area for Rowlett Creek is 120 square miles. Rowlett Creek is a tributary to the East Fork of the Trinity River, which eventually flows into the Gulf of Mexico. A small, spring-fed tributary to Spring Creek. An inventory of springs in the area is needed. Below is a plot of the mean annual discharge at Rowlett Creek from 1969-1998. A disturbing trend is the increase in discharge in more recent years possibly due toland clearing and coversion to industrial and residential development along with acres and acres of paved roads. Flashier storm peaks increase the erosion potential along stream banks and causes fluvial geomorphologic changes in the river system such as headcutting and meander widening. The mean annual flow has generally increased over the 29 years of record, as evidenced in the graph. A watershed needs to have about 15-20 percent of its landscape free of roads and development (pervious versus impervious) in order to function properly….this includes groundwater recharge, stream equilibrium (balance of aggradation and degradation), near normal aquatic biological communities, normal surface temperatures, flood attenuation, and for functions that remain undiscovered. The following is information by the U.S. Geological Survey Water Resources Division: Nonpoint source stormwater runoff in urban areas is now a leading threat to water quality, and the percentage of impervious surface within a particular watershed has been recognized as a key indicator of the effects of nonpoint runoff and of future water and ecosystem quality (Arnold and Gibbons, 1996; USEPA,1994). The imperviousness issue has even been suggested as a unifying theme for overall study of watershed protection (Schueler, 1994) and as part of an urban ecosystems analytical model (Ridd, 1995).
Impervious surfaces can be generally defined as any material of natural or anthropogenic source that prevents the infiltration of water into soil, thereby changing the flow dynamics, sedimentation load, and pollution profile of storm water runoff. The growth of impervious surfaces is directly related to human activity and habitation through the construction of buildings, roads, parking lots, sidewalks, and so on. As precipitation is diverted from possible soil infiltration, the unfiltered flow over the impervious surface allows significant increases in water runoff, as well as a rise in the acquisition and retention rate of chemical contaminants and sediments from anthropogenic sources. The subsequent surge in the in flow rate and volume in the receiving stream brings about an enlargement of bank-full and stream scour events and significantly influences the morphological structure. The in-stream and riparian ecology is thus altered owing to changes in structural habitat and the related increases in sedimentation and pollution loadings (Arnold and Gibbons, 1996). What can you do to protect your streams and watersheds? Form a homeowners association, or urge your city council to implement plans to leave open space as well as riparian areas along streams, use best management practices or BMPs to reduce erosion and protect stream health, and preserve wildlife habitat in your watershed. Also refer to the smart growth links on this website. Below is a one-year plot of streamflow from March, 2000 to mid-February, 2001. Discharge, measured in cubic feet per second (cfs), was very low from June 21, 2000 until October 14, 2000. Winter rains returned with a recent flood peak of over 7,000 cfs in February, 2001. (Graph modified from original USGS graph for educational purposes). Watershed protection U. S. Environmental Protection Agency Region 6″To encourage stewardship of the nation’s water resources and to celebrate more than 25 years of progress under the Clean Water Act, the Environmental Protection Agency (EPA) is leading an “Adopt Your Watershed” campaign. Through this effort, EPA challenges citizens and organizations to join us and others who are working to protect and restore our valuable rivers, streams, wetlands, lakes, ground water, and estuaries.” See the EPA Adopt Your Watershed web site
See the EPA Adopt Your Watershed web site

A Hydrologic Unit Code or “HUC” is an accounting system to track all of the Nation’s watersheds. The United States is divided and sub-divided into successively smaller hydrologic units which are classified into four levels: regions, sub-regions, accounting units, and cataloging units. Each hydrologic unit is identified by a unique HUC consisting of two to eight digits based on the four levels of classification in the hydrologic unit system. Below is map of HUC 12030106 with Spring Creek Preserve in green: Surf Your Watershed site by the U.S. Environmental Protection Agency provides information on watershed conditions by “HUC” or hydrologic unit code, East Fork Trinity, USGS Cataloging Unit: 12030106. At this site you can click on several sources of information, including IWI or Index of Watershed Indicators. The overall IWI score describes the health of the aquatic resources for this watershed. A score of 1 indicates Low Vulnerability to stressors such as pollutant loadings. Other information includes hazardous mat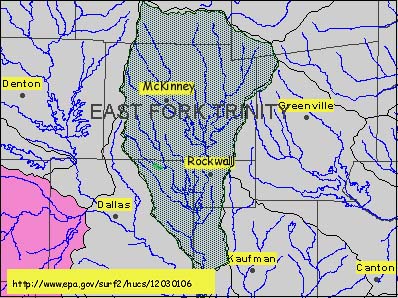 erials sites, information on groundwater, and other environmental characteristics of this watershed. Spring Creek is a tributary to Rowlett Creek, which covers about 120 square miles in parts of seven counties. Rowlett Creek is a major tributary to East Fork of the Trinity River. Refer to the following url for more information: http://cfpub1.epa.gov/surf/huc.cfm?huc_code=12030106 The Rowlett Creek watershed, which includes Spring Creek and Prairie Creek, runs through many cities in the north Dallas area. Local cities worked with North Texas Council of Governments (NTCOG) to preserve the natural stream corridor, create vegetative buffer zones, lessen extreme stream velocities, and create uniform guidelines for runoff detention basins to reduce nonpoint source pollution. Water Resources Information WATERS new website maps water quality River Network – River Network has announced the recent launch of its new database information on Clean Water Act contacts by State West Gulf River Forecast Center – National Weather Service National Atlas of the United States – you can produce your own map to view your watershed. click to enlarge Trinity River Basin – National Water Quality Assessment (NAWQA) Animation of Daily Streamflows Maps – USGS Water Quality in the Trinity River Basin – USGS data 1992-1995 Quality of Ground Water in Aquifer Outcrops – Trinity River Basin; USGS U.S. Geological Survey Water Resources Division Dallas/Ft. Worth Climatology – National Weather Service Forecast Office